UI/UX | MICROSOFT AI
COGNITION
Quartz Creative and Microsoft have created an AI that reads Quartz.
Cognition is a tool that reads and interprets Quartz in a way no human reader could.
In charge of the entire UI and UX design and creating visuals for ad campaigns.
CLIENT
Microsoft
AGENCY
Quartz Creative
DESIGN
Michael Zhou
DEVELOP
Slobodan Dabovic & David Dodson
CONTENT
Noah Pisner

Utilizing machine learning and natural language processing, Cognition is a way for users to see how the economic, technological, and cultural pillars of today's world interact with one another. Thousands of articles and ideas have been mathematically sorted and visualized — providing a new way to discover news and a peek into how machine learning works.
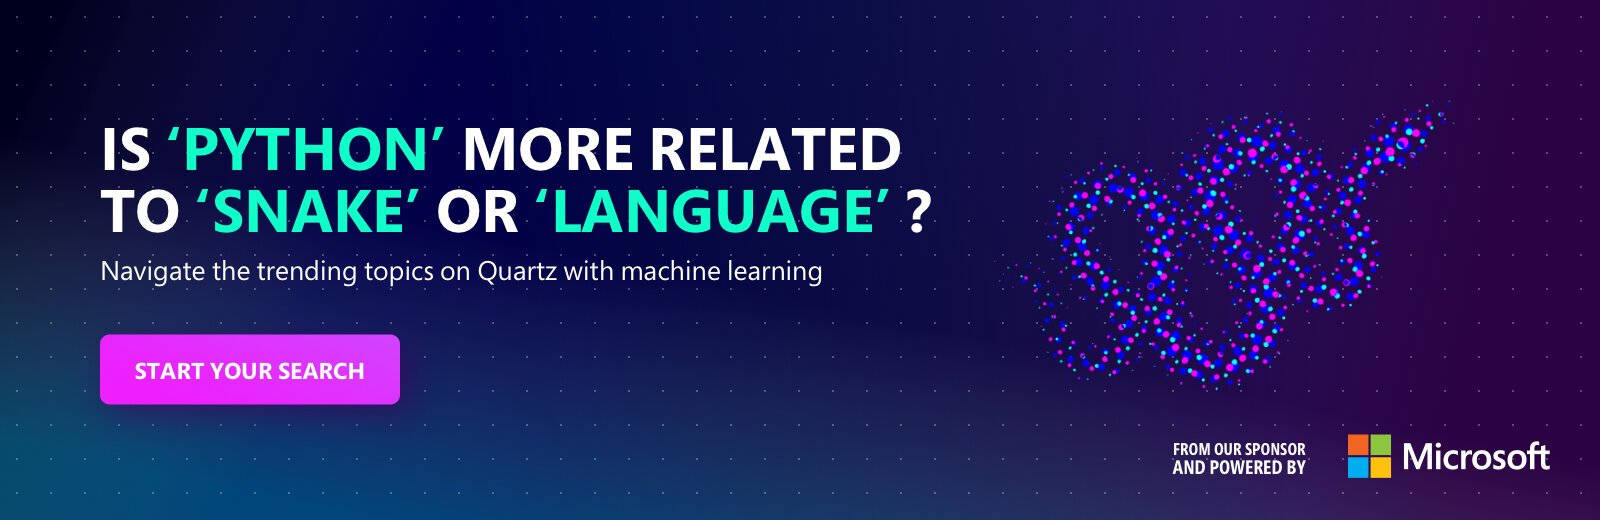
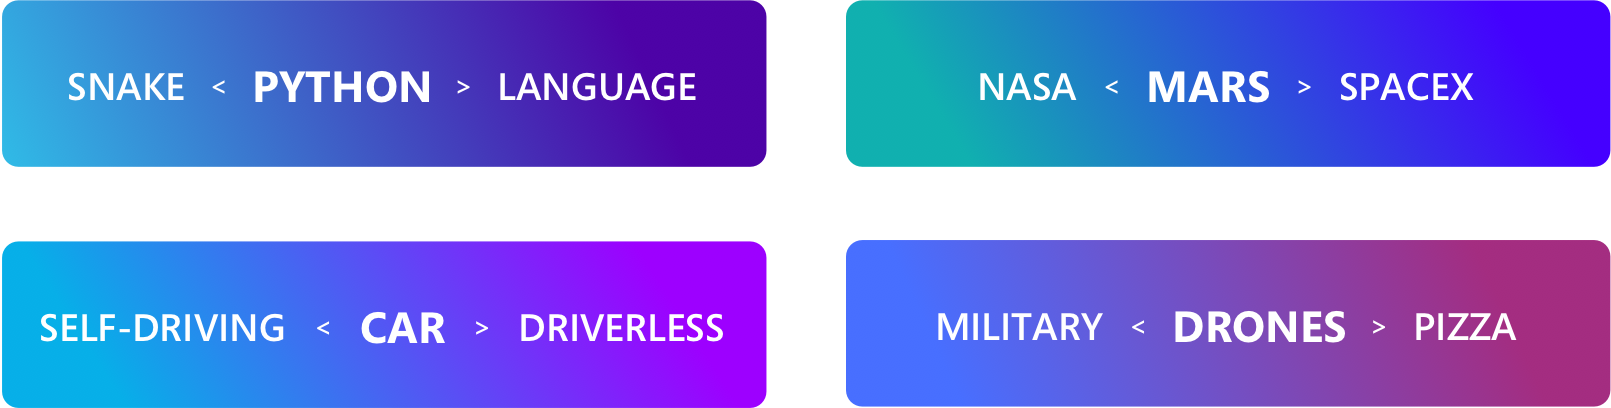
Cognition is a tool for curious readers to go deeper into the topics they care about, helping identify often unexpected connections between terms and items of interest in a way you wouldn't find in a linear experience. How is "pizza" related to "drones?" What does "python" have to do with "language?"
As a result of the experience, users reported a 50% brand lift in their perception of Microsoft as a leader in AI.


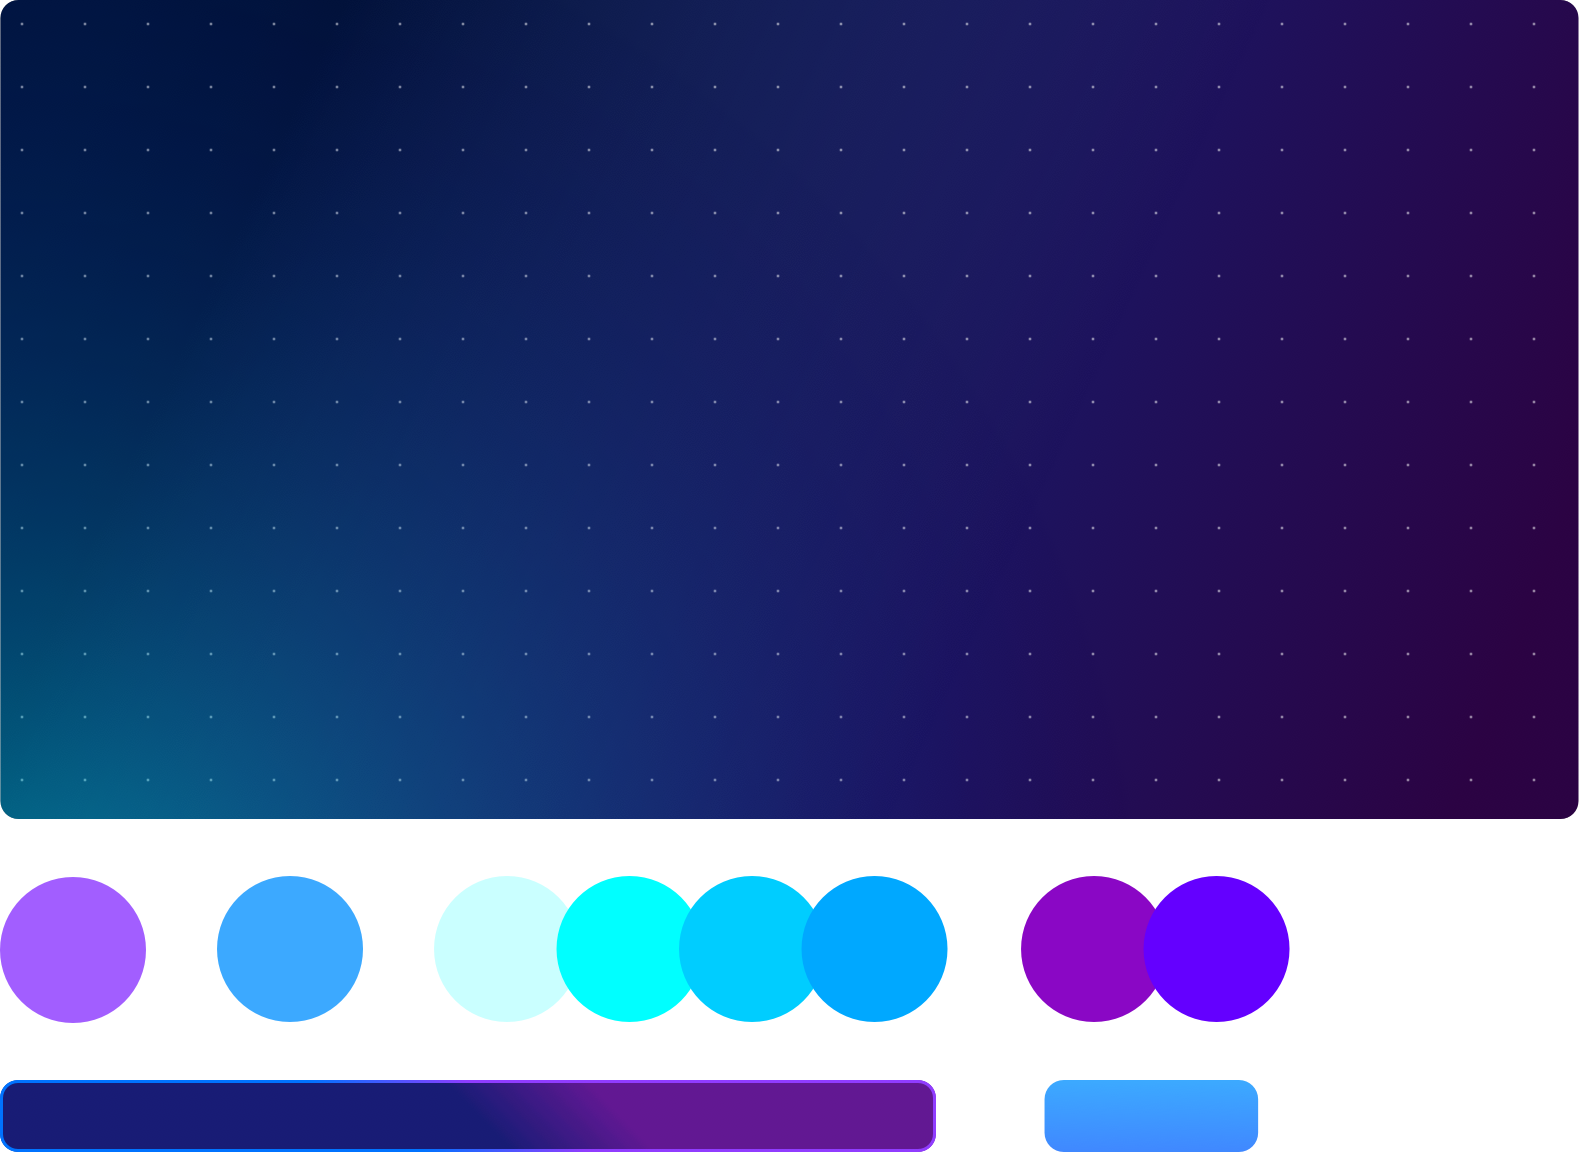
COLOR
As the main color pallet of the overall design, different shades of purple and blue bring the futurist and technological look and feel to this interactive that promotes and utilizes the power of Microsoft artificial intelligence. The grid formed by dots in the background adds a subtle layer of depth to the design, also works a representation of the corpus running in the background. Gradients are heavily used in this interactive not only to give a more multi-dimensional setting for the website but also portray the connection between words.
TYPOGRAPHY
Incorporating gradient and creative layering helps to make the standard Microsoft brand fonts fit into the overall design style, as well as builds a visual connection between two words.

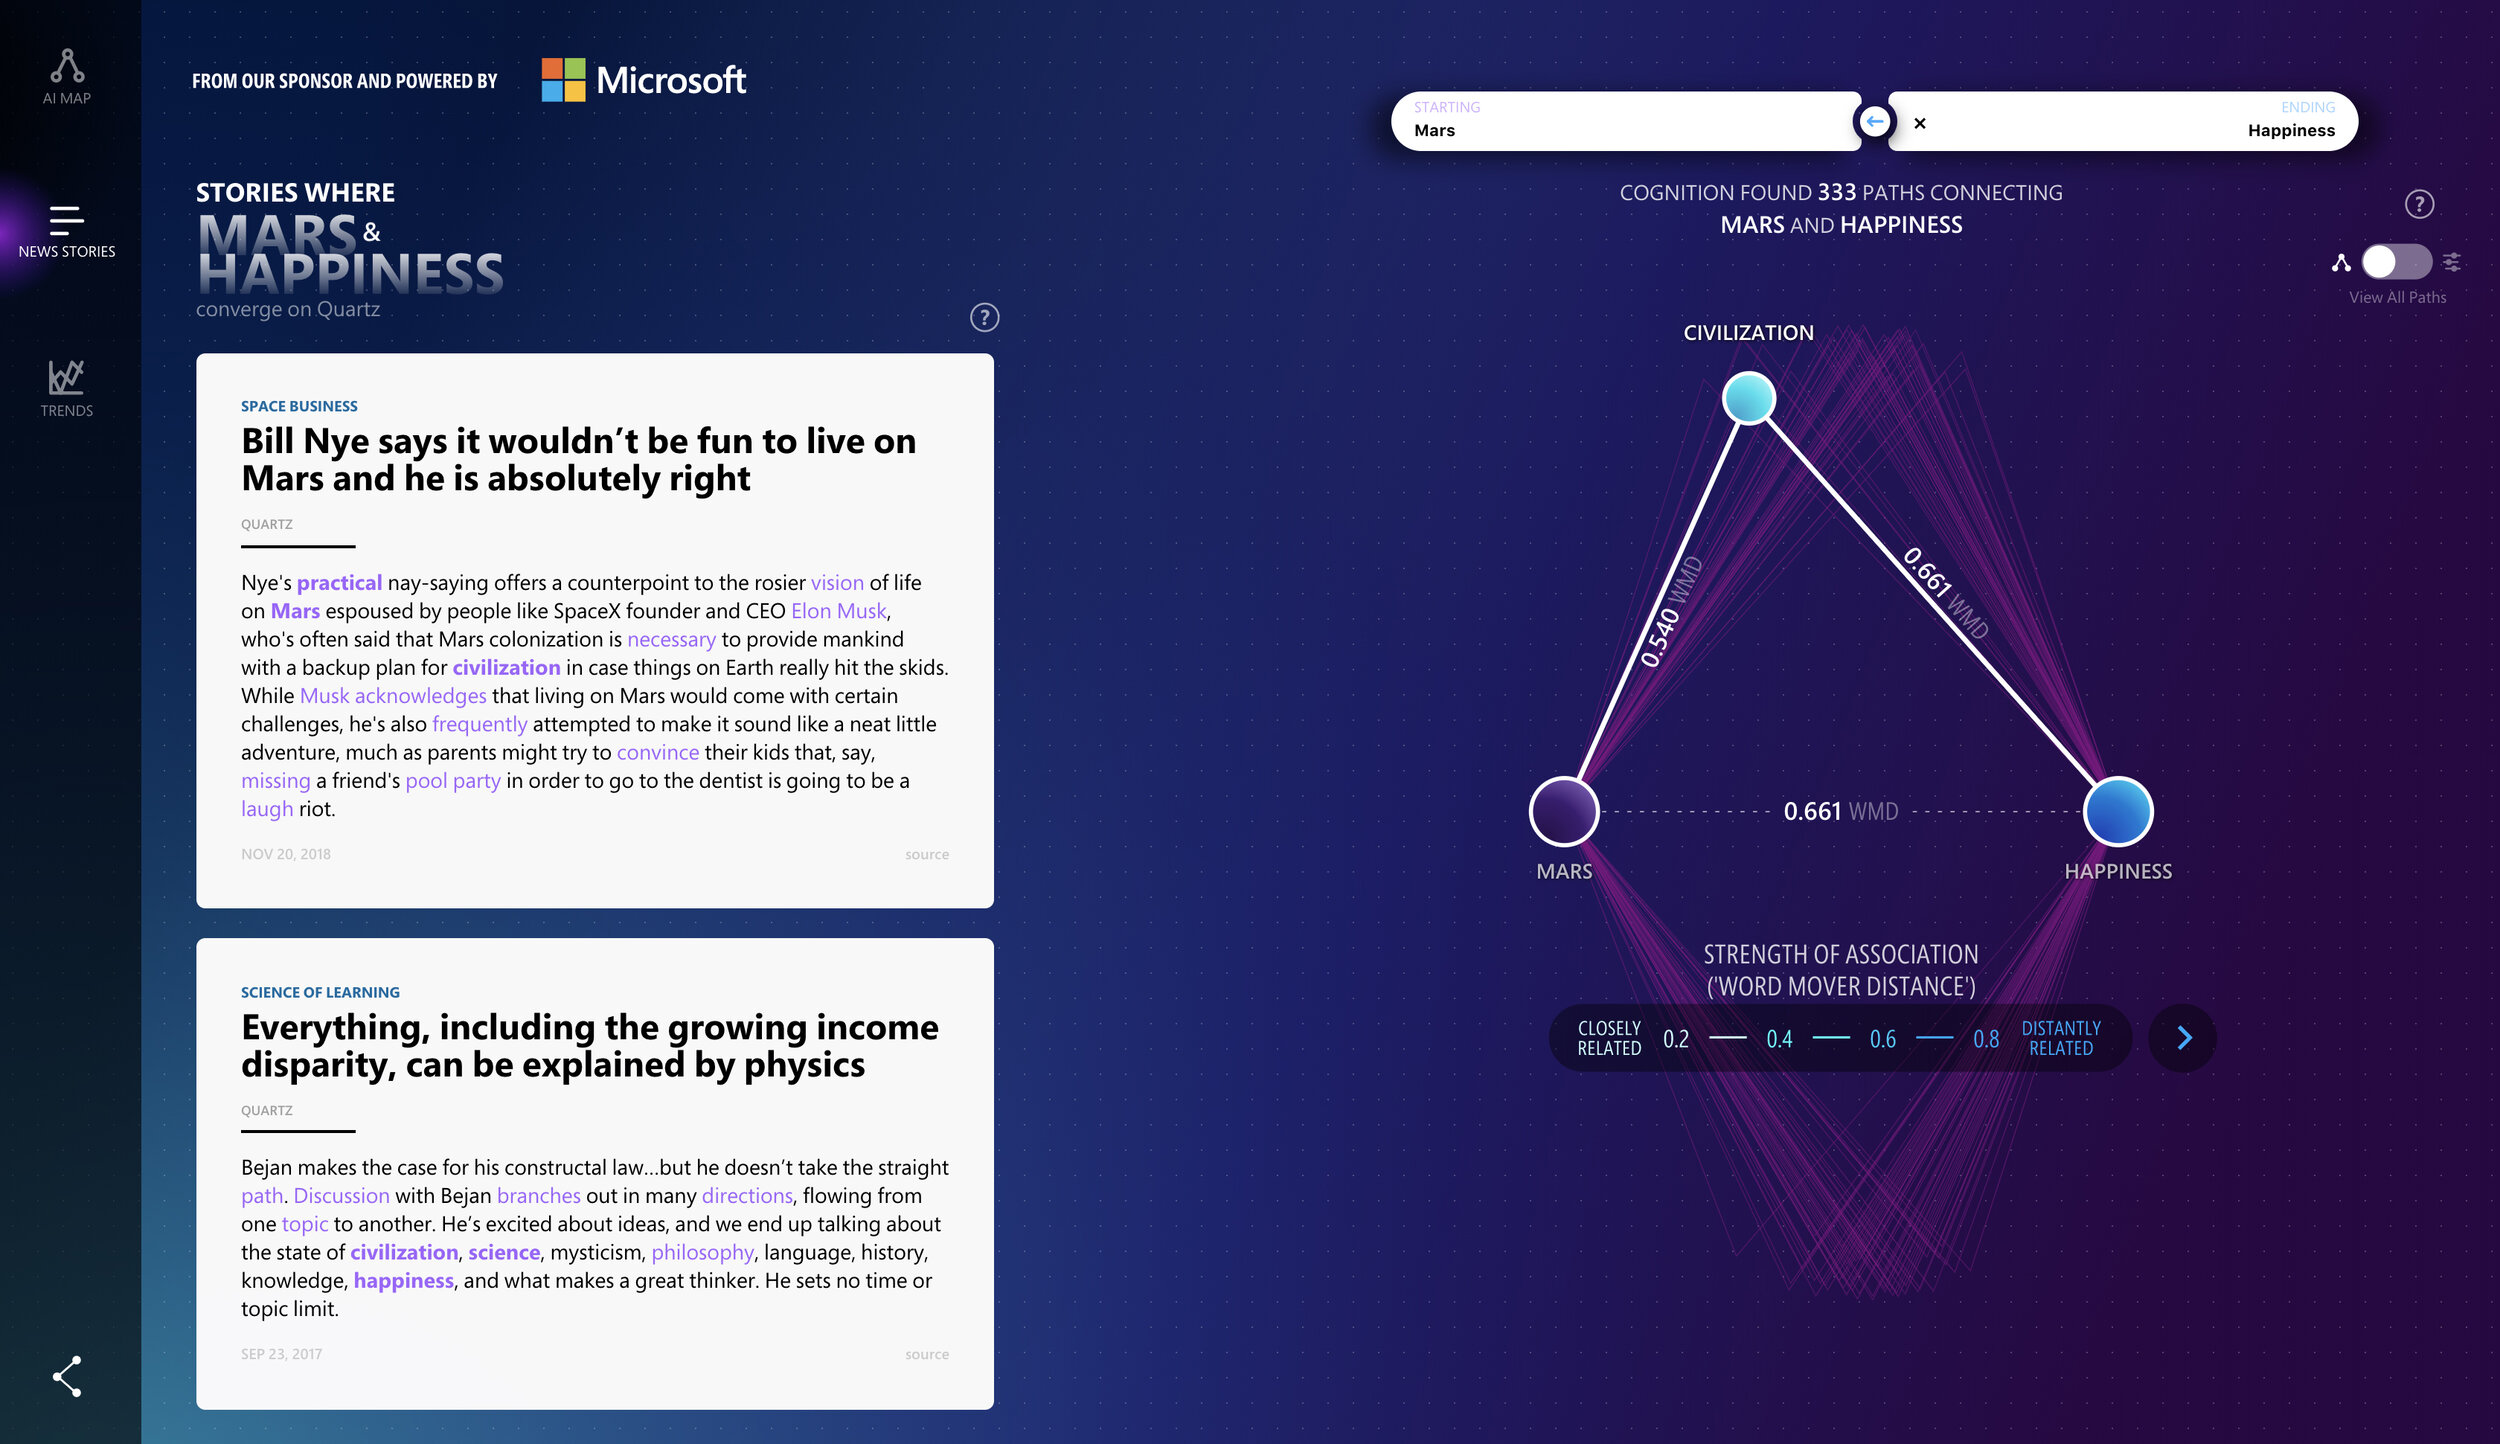
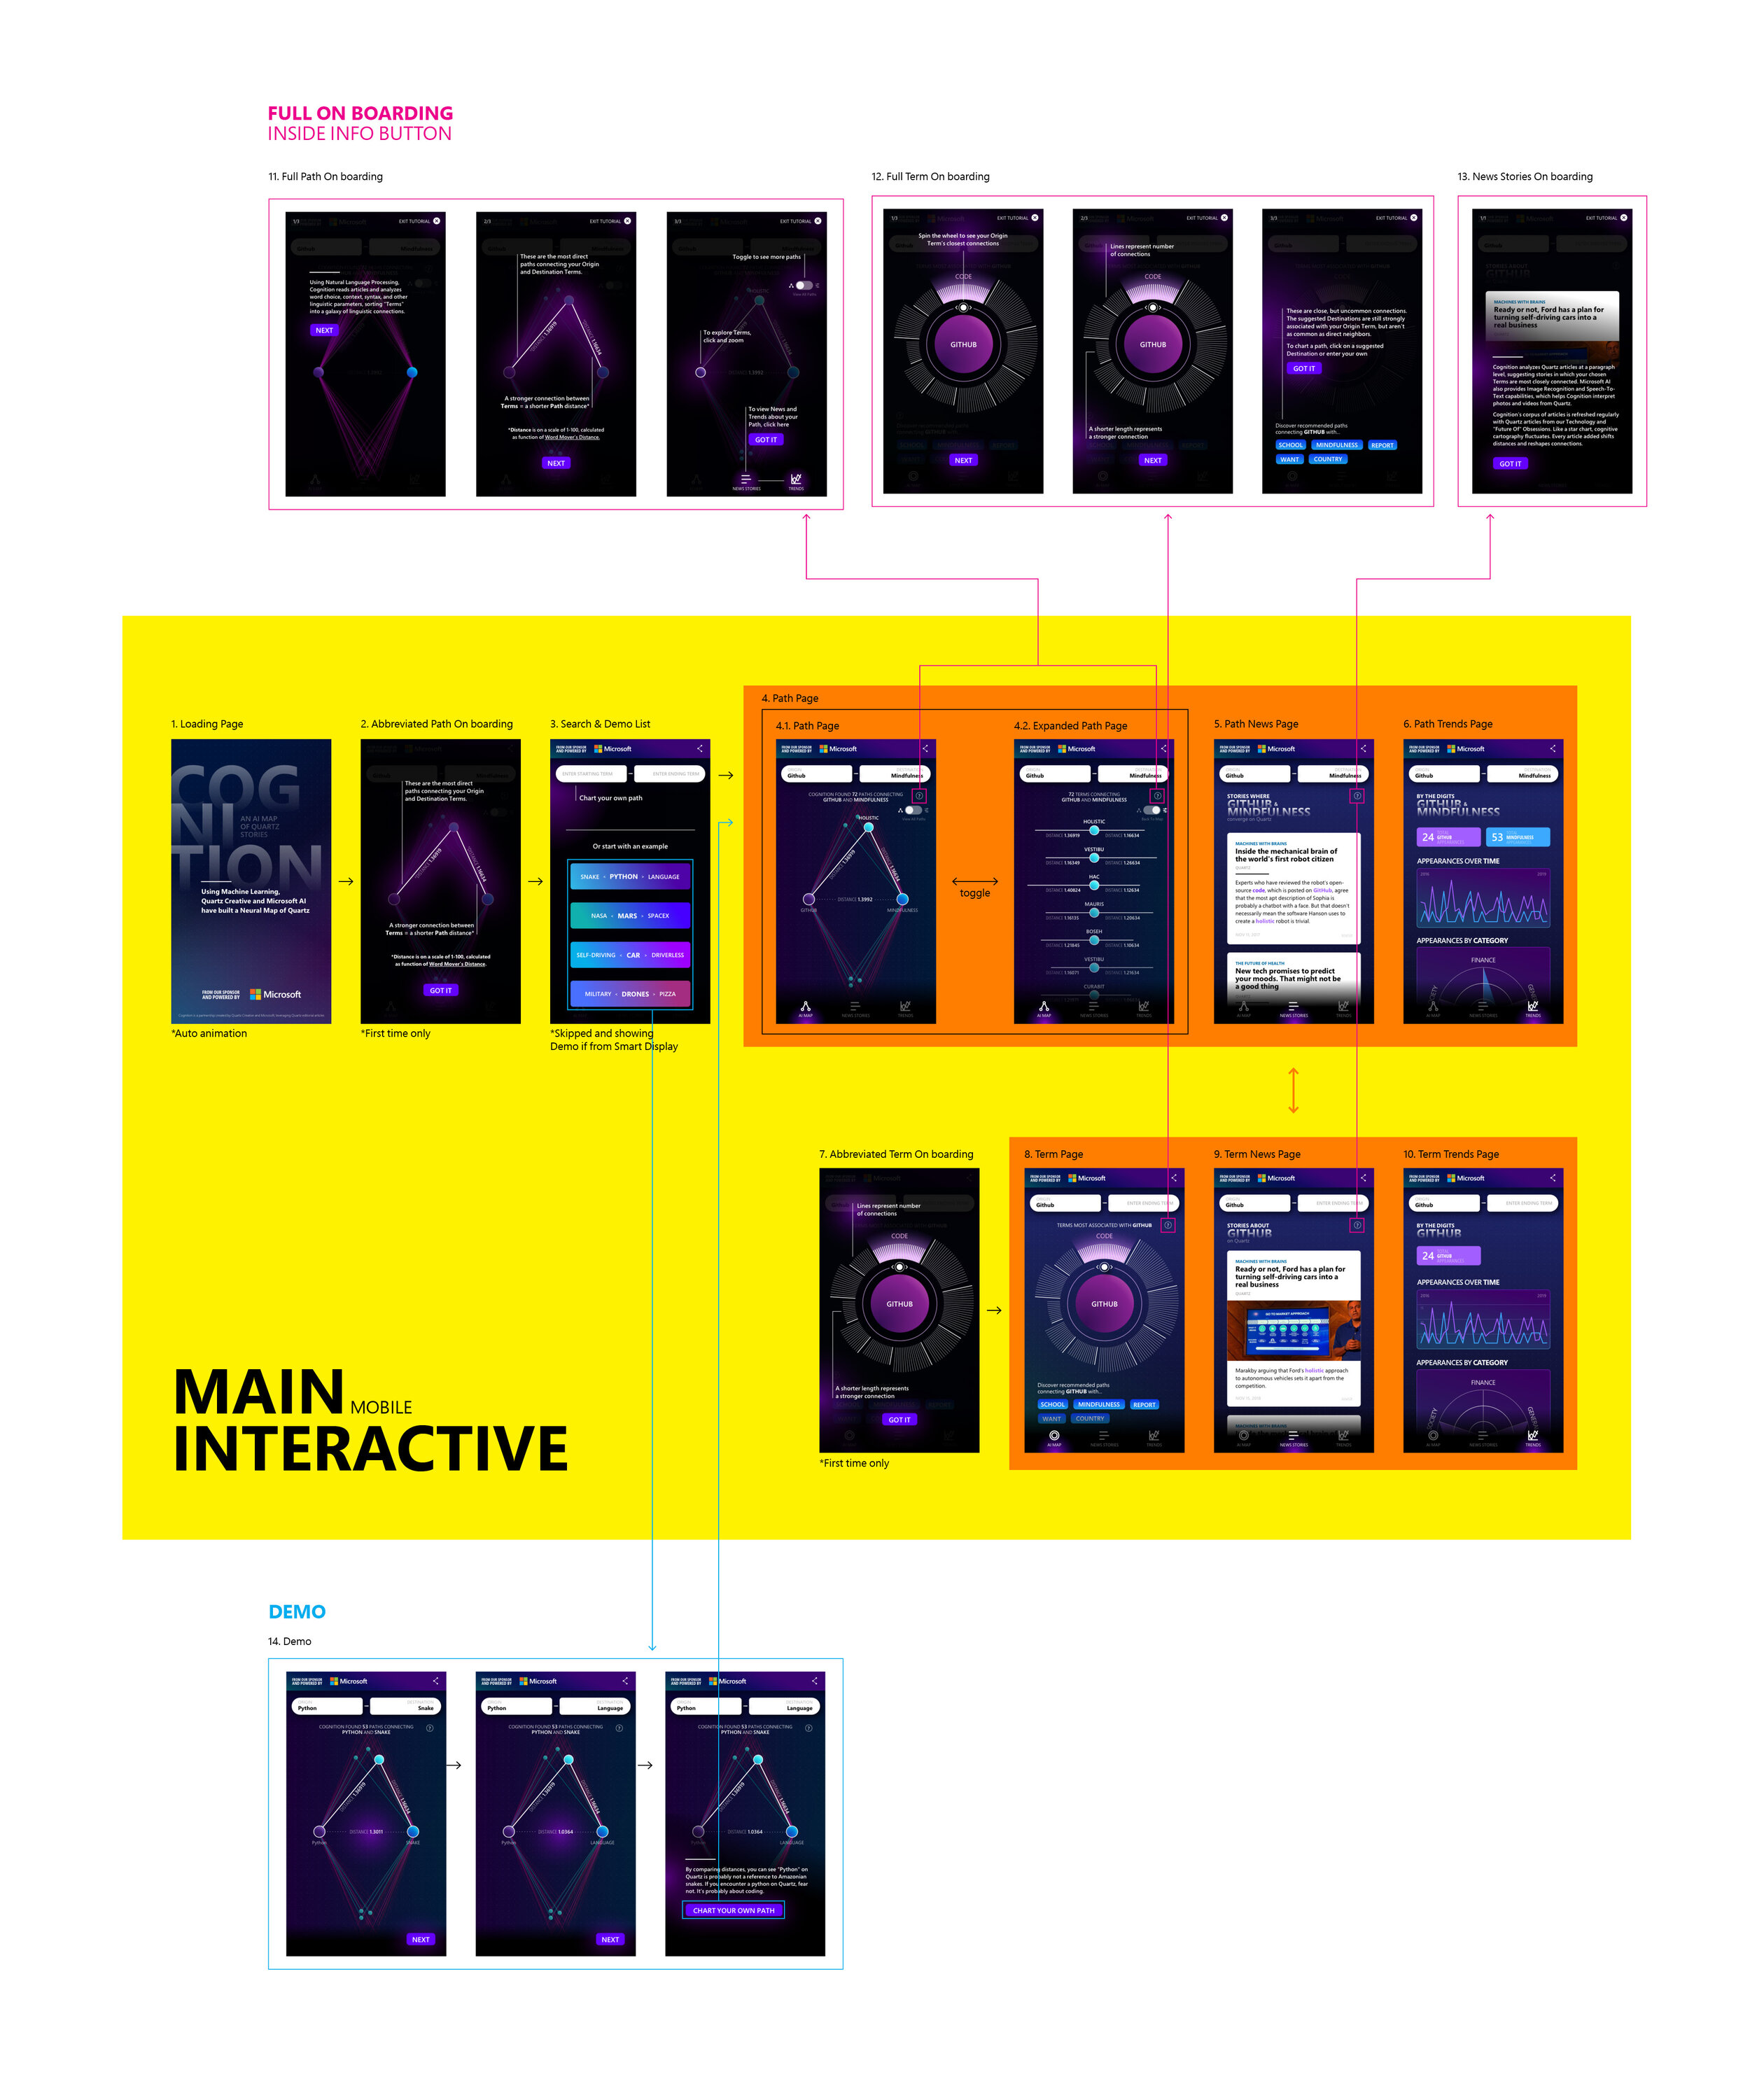
SEARCH BAR
The starting and ending terms are color-coded with purple and blue in the search bar, and throughout the entire website. They help the user to navigate through paths, news, and charts. The middle blue arrow pushes the ending term to the starting term field and starts a new search, as well as displays the term wheel, which presents detailed information of the word.

DATA VIZ
This graph illustrated all the possible path and connection between two words. The distance ruler helps the user to understand how closely they are related. The highlighted white path as the current view path can be navigated through the two arrows next to the ruler. The experience provides two views of all the connections. The triangle view offers a unique visualization of all paths, while the list view is easy and clear for the user to dig deeper into each possible connection between two words.
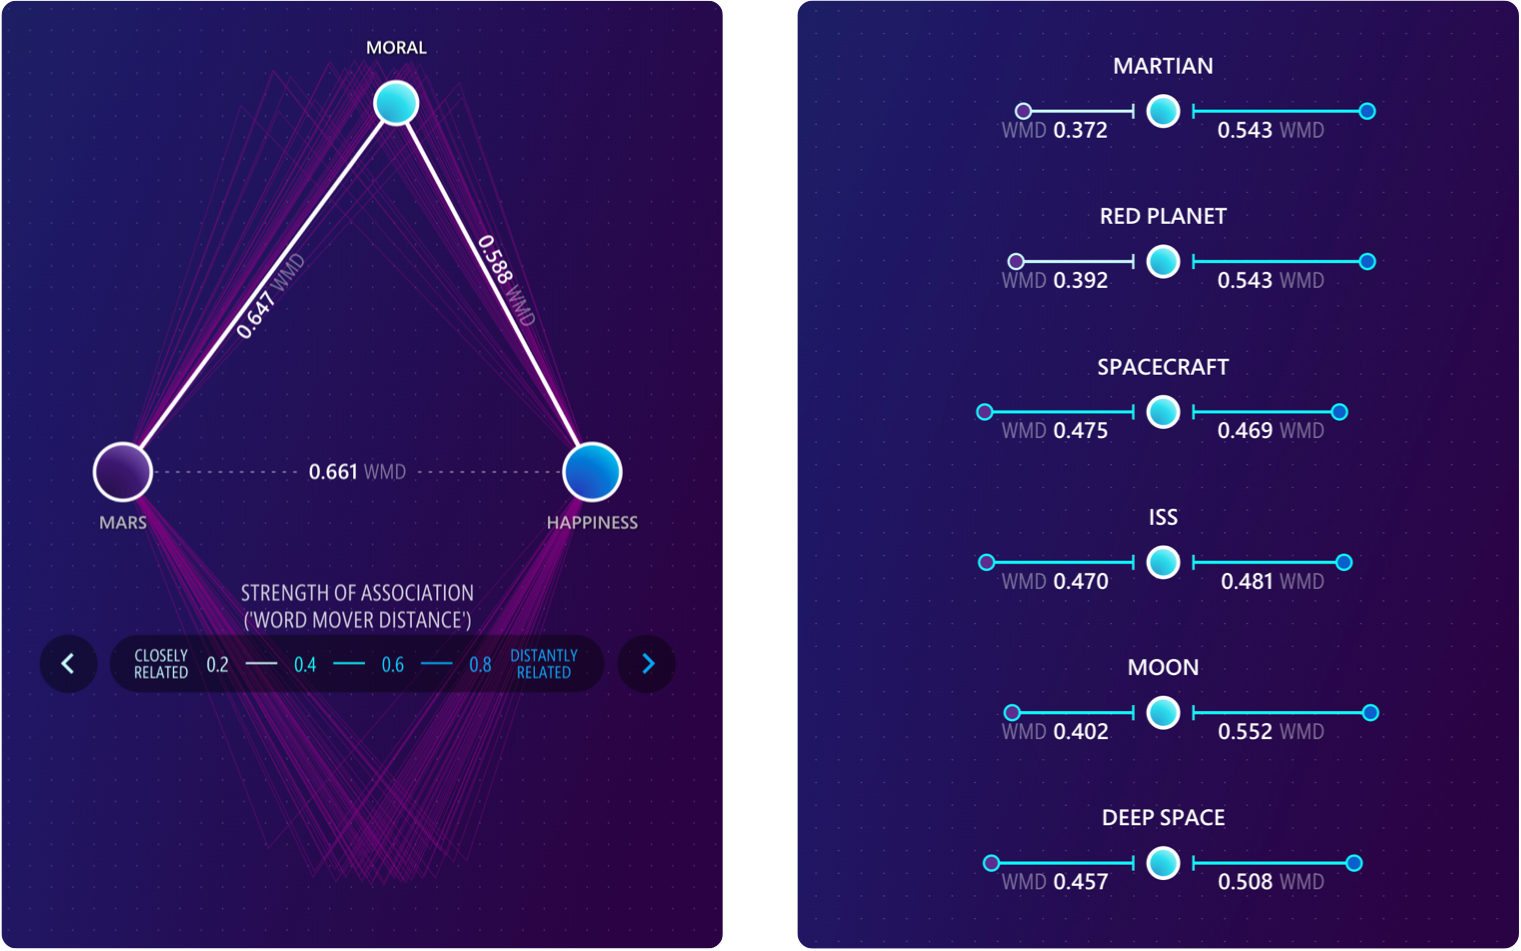
DISTANCE RULER
Segmented by four shades of blues, it helps the user to understand the meaning of distance and the relationships of each connection.

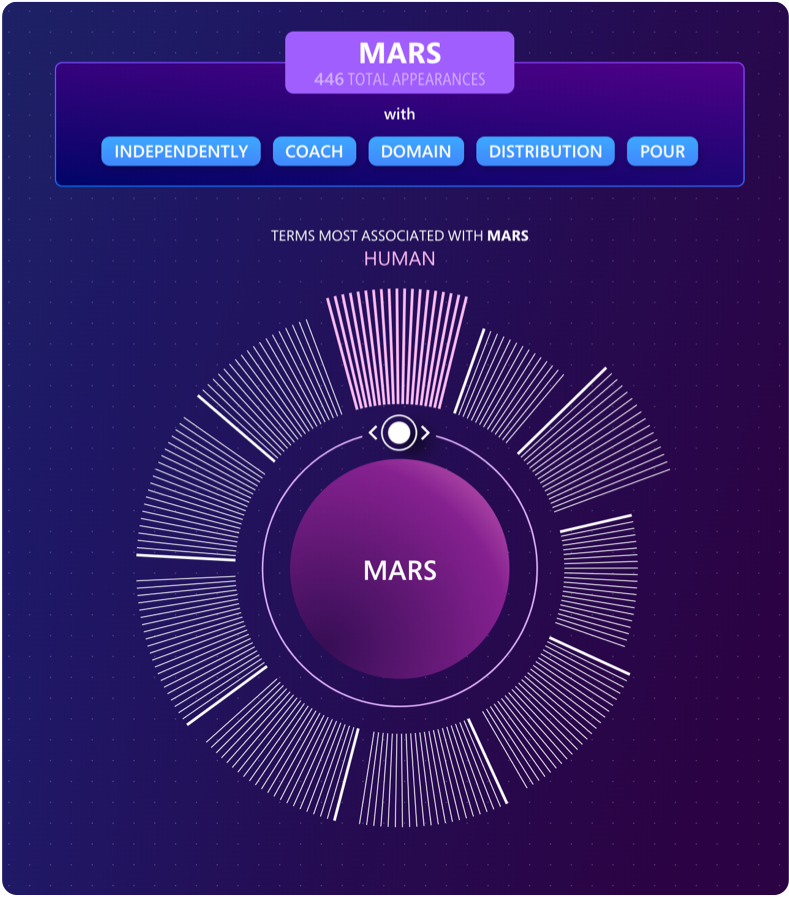
APPEARANCE COUNTER
Color-coded the same way as the search bar, each box displays how many times each term is mentioned in the corpus. They serve as a set of data, as well as keys for each chart in the Trend page.

TERM WHEEL
Using algorithm and AI, suggestion interesting and unexpected connections with the searched word. The wheel shows the most associated words of the searched word. Lines represent the number of connections, and a shorter length represents a stronger connection.
TRENDING PAGE
Cognition has the ability to look at how terms appear overtime and are categorized. This view is for those that are really interested in the numbers and changes over time.

NEWS STORIES
Cognition analyzes Quartz articles at a paragraph level, suggesting stories in which your chosen Terms are most closely connected. Microsoft AI also provides Image Recognition and Speech-To-Text capabilities, which helps Cognition interpret photos and videos from Qz.com.

DEMOS
To ensure each new user fully understand the value and function of Cognition, we included several sets of curated demos that tell inspiring stories based on the outcome of the tool.
SMART DISPLAYS
To optimize promoting results, Quartz Creative developed a system that can analyze each user's behavior and interests. Base on the learning from the data, we prepared and designed six sets of smart displays. The backend system will distribute each traffic driver to different users according to their taste and interest. Each traffic driver also features a custom visual that depicts the core idea of the headline.